Plotting Org Table Weight Loss Using gnuplot
Now I have a weight loss org table defined and therefore an easy way to track the total amount of weight loss each week I had an idea for an improvement with some form of a satisfying graphical representation.
I have been aware of gnuplot for while now and I think this is an opportunity to give it a try through org-mode
The first step is a simple (use-package gnuplot)
here is the original table:
| date             | weight | pounds | loss | total |
|------------------+--------+--------+------+-------|
| <2023-08-18 Fri> |   15:5 |    215 |      |       |
| <2023-08-25 Fri> |   14:9 |    205 |  -10 |   -10 |
| <2023-09-01 Fri> |   14:2 |    198 |   -7 |   -17 |
| <2023-09-08 Fri> |  13:11 |    193 |   -5 |   -22 |
#+TBLFM: $3='(convert-weight $2)::@3$4..@>$4=$3-@-1$3::@3$5..@>$5=vsum(@$4..@3$4)
and with a little investigation and trial and error I came up with:
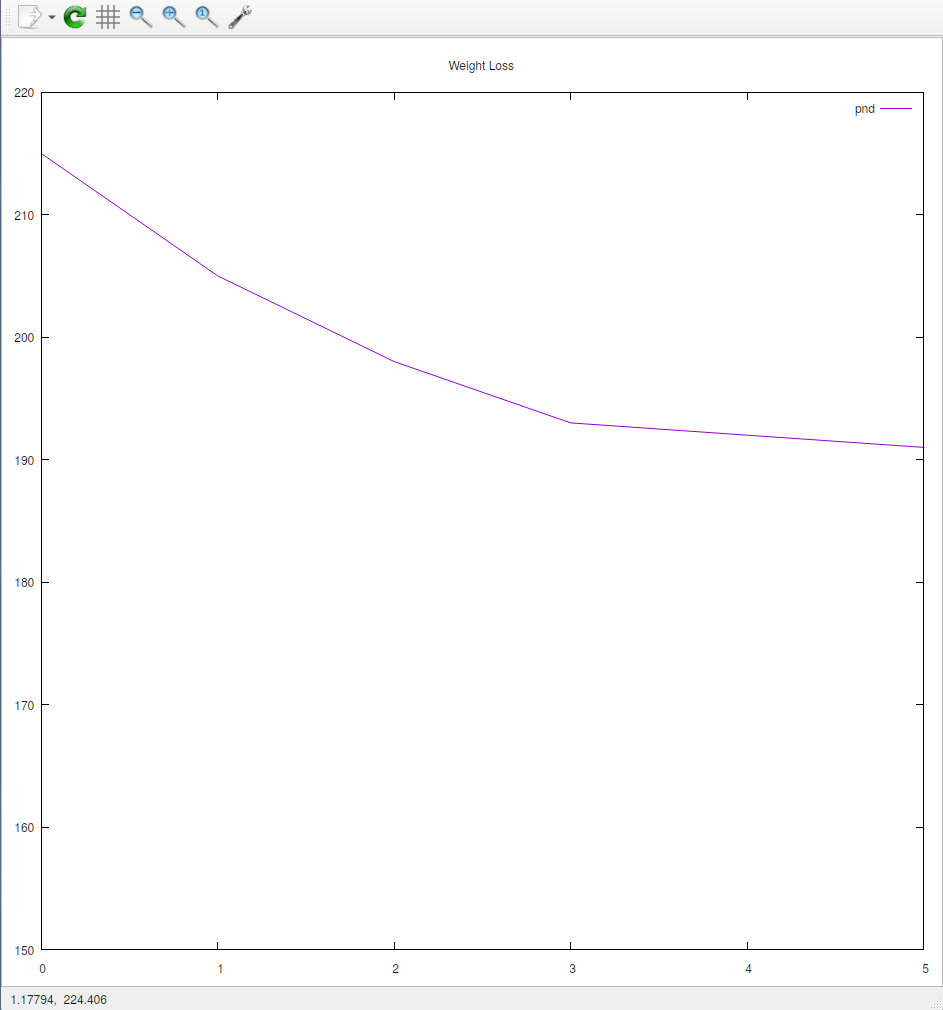
#+PLOT: title:"Weight Loss" ind:1 deps:(4) type:2d with:lines set:"yrange [150:220]"
|   | date             |   stn | pnd | lss | tot | bar            |
|---+------------------+-------+-----+-----+-----+----------------|
| 0 | <2023-08-18 Fri> |  15:5 | 215 |     |     | WWWWWWWWWWWWWH |
| 1 | <2023-08-25 Fri> |  14:9 | 205 | -10 | -10 | WWWWWWWWWWWV   |
| 2 | <2023-09-01 Fri> |  14:2 | 198 |  -7 | -17 | WWWWWWWWWW;    |
| 3 | <2023-09-08 Fri> | 13:11 | 193 |  -5 | -22 | WWWWWWWWW:     |
| 4 | <2023-09-15 Fri> | 13:10 | 192 |  -1 | -23 | WWWWWWWWW      |
| 5 | <2023-09-22 Fri> |  13:9 | 191 |  -1 | -24 | WWWWWWWWV      |
#+TBLFM: $4='(convert-weight $3)::@3$5..@>$5=$4-@-1$4::@3$6..@>$6=vsum(@$5..@3$5)::$7='(orgtbl-ascii-draw $4 150 220 15)
The first thing to point out is that as I was learning more about org tables I came across the orgtbl-ascii-draw function which visually is quite self explanatory as shown in the bar column. The main arguments are the x axis range (150-220) and the span in characters (15)
Now on to the main plotting change and that is defining a #+PLOT header setting out all the parameters I want fed into gnuplot from the org table.
Again most of the defines are self explanatory and the only issue I ran into was trying to get plot lines to be rendered based off the original first date column. The histograms display did work and correctly listed each week with the corresponding bar value but lines only displayed a single vertical line at a 2023 value.
I am guessing in the case of a line display the data is plotted in a more non discrete manner and the date was parsed as best it could and just plucked out the first part of the date string which was the year. I decided not to investigate this and instead simply added another column with a simple numbering scheme and set my x axis off of that. I only want to see a plot over a number of weeks so I don't care about the display of the date.
So now lets generate the gnuplot! which can be accomplished by running C-c " g (org-plot/gnuplot):